


- May Jadallah
- http://mayjadallah.weebly.com/
- Associate Professor
- Promoting Students' Spatial Thinking in Upper Elementary Grades using Geographic Information Systems (GIS)
- http://education.illinoisstate.edu/nsf/
- Illinois State University
- Alycia Hund
- https://about.illinoisstate.edu/amhund/Pages/Other-Links.aspx
- Professor
- Promoting Students' Spatial Thinking in Upper Elementary Grades using Geographic Information Systems (GIS)
- http://education.illinoisstate.edu/nsf/
- Illinois State University
- Joel Studebaker
- http://joelgarthstudebaker.com/
- Project Manager
- Promoting Students' Spatial Thinking in Upper Elementary Grades using Geographic Information Systems (GIS)
- http://education.illinoisstate.edu/nsf/
- Illinois State University
- Jonathan Thayn
- http://my.ilstu.edu/~jthayn/Welcome.html
- Associate Professor
- Promoting Students' Spatial Thinking in Upper Elementary Grades using Geographic Information Systems (GIS)
- http://education.illinoisstate.edu/nsf/
- Illinois State University


Public Discussion
Continue the discussion of this presentation on the Multiplex. Go to Multiplex
Arthur Camins
Director
The enthusiasm of the teachers and students is evident! Viewers might be interested to hear more about how students use GIS to support their learning of STEM concepts.
Joel Studebaker
Project Manager
Thank you for the feedback! We presented more information about the curriculum and our goals in our video for last year’s Video Showcase:
http://resourcecenters2015.videohall.com/presen...
We’re always happy to answer questions about the program!
May Jadallah
Associate Professor
Our curriculum supports STEM learning in a number of ways including engaging students in collaborative problem-solving of real-life challenges, using mathematical ideas, making and testing predictions, and applying technological tools to think about and resolve issues.
Students learn mathematical core ideas such as set theory concepts including intersect, union, and difference, in addition to buffer, a geo-processing function. These concepts and functions are activated as tools using a GIS software.
GIS is an advanced digital mapping technology that assists users in finding solutions to complex challenges in ecology, geography, and history.
We are very excited about our curriculum and would like to invite all those who are interested to check out our website to learn more about it.
Sarah-Kay McDonald
Principal Research Scientist
Thanks for sharing these insights into your project. I’d be very interested in learning more about the settings in which the QGIS curriculum has been used to date, and any findings and/or ongoing research documenting/exploring how use of the software affects student learning outcomes (e.g., spatial abilities, interest & engagement in STEM, critical thinking, socio-emotional learning). Are any of these being explored as part of the current project, and/or planned foci for future investigations?
May Jadallah
Associate Professor
These are great questions. We used a number of instruments to examine the impact of our GIS curriculum including: a cognitive ability test, geography items of the National Assessment of Educational Progress (NAEP) test, an interest questionnaire, a technology questionnaire, and a transfer test.
We found that the curriculum has an impact on students’ spatial abilities, map skills, collaboration, and interest in the use of technology to solve problems. Students were found to be more likely to explore multiple solutions to problems and use a variety of higher-level thinking processes during their collaboration.
Sarah-Kay McDonald
Principal Research Scientist
Very interesting- thanks, May! Any chance you could point viewers towards any presentations/reports on these findings? I for one would love to learn more! Best, Sarah-Kay
May Jadallah
Associate Professor
Happy that you asked about reports and presentations Sarah-Kay! The middle of this page: http://www.teachatlas.com/our-research.html#pre... includes some of our presentations in PDF covering results from all instruments used in our study.
Elizabeth Kirby
What I found most exciting about the project was the close collaboration between the research team and the participating teachers and students in the design of a study that was not merely scientifically sound, but interesting and engaging to the teachers and their students. Creating a love of learning and conveying the tools by which it can be accomplished is a gift that lasts a life time. Responses to the study suggest that many of the participants engaged in the activities on that deep and fundamental level.
Jonathan Thayn
Associate Professor
One of the great things about mapping and GIS is that everyone “gets it” intuitively. There’s a map-following treasure-hunter in all of us. It’s very easy to make a project like this interesting and engaging.
May Jadallah
Associate Professor
Elizabeth, we are very grateful to the great insight that you provided as a project consultant regarding the collaboration with the teachers and students. All schools we worked at were very supportive and welcoming; we also highly appreciate the cooperation we received from participating school districts. It was certainly very rewarding to collaborate with the teachers and build bridges of trust with schools and students.
Jonathan, you are on target, the students became more independent as the modules progressed.
Kim Kastens
Hi Jonathan, I’m wondering about your comment about that “everyone ‘gets it’ intuitively” about maps and GIS. It seems to me that there are a substantial fraction of adults who don’t “get it” about maps, and who are in fact somewhat map-phobic. In the old days, those would be the people who, when handed the map and asked to navigate in a car (in the days before consumer GPS devices), would hand it back and say “oh, you do it, I don’t do maps,” or “I’m not a map person.” In the new era, those would be the people who print out Google-map turn by turn instructions, but not the map. I’m wondering what it is about the map-using situation you are establishing in your classrooms that differs from the map-for-navigation situation that enables “everyone” to be comfortable and “get it”?
Joel Studebaker
Project Manager
Hi Kim, I’ll jump in for Jonathan. I think the difficult thing about navigation is connecting our own sense of place to the space on the map. When using maps in a car, for example, you must be able to identify where you are on the map, what direction you are moving in, and then make a judgement about where to go next. There’s usually a great deal of pressure, too! If you read the map wrong you could end up missing a turn or turning in the wrong direction. Obviously the immediate consequences can be quite intimidating!
In our curriculum, students are not concerned with their own placement or their own direction, so they can focus on the relative placement of data on the map. The most important feature in GIS is the ability to separate maps into layers, which is very helpful for learners. If we had a map with highways, forests, and mountains, for example, we could choose to look only at the highways and “turn off” the rest of the layers to make that portion of the map easier to read.
Because the maps can be simplified at any time by the learner, it is much simpler to make sense of the information the map is communicating.
Joel Studebaker
Project Manager
We would like to invite everyone to view our new website, www.teachatlas.com, as well. We’ve outlined the curriculum there, and will be making all of our materials for students and teachers available for free to teachers there in the coming months. We’re incredibly excited that this project allowed us to create new resources for teachers and can’t wait to share them with as many teachers as possible.
Joel Studebaker
Project Manager
May pointed out a number of the outcomes we have observed. You can find a number of the posters and presentations we’ve given in recent years here at our other website, though we still have data to collect, analyze, and report on. http://education.illinoisstate.edu/nsf/presenta...
Beth Schlemper
This is awesome! I’m glad to see these efforts at younger age levels.
Joel Studebaker
Project Manager
We’ve been astounded by what 5th grade students are capable of. At every turn, they’ve caught on to this technology and the way they can solve problems with it faster than we would have imagined!
May Jadallah
Associate Professor
Thanks Beth, we are starting early because we want to capture the students’ attention and build their skills and cognitive processes early on so that by the time they work on projects like yours they are ready and take them to much higher steps! It is wonderful that your project and ours try to focus on local issues.
Dani Kabbes
Love that the students seem to really take ownership and are empowered. Awesome work being done here to promote STEM for younger students.
Joel Studebaker
Project Manager
We’ve found that students want to take ownership — we just have to give them the opportunity, and give them the tools to thrive.
May Jadallah
Associate Professor
Thanks Dani. One of the things that we were delighted to see is the collaboration and the gradual independence from direct teacher supervision. In addition, students who were able to successfully complete certain steps in some exercises became the young experts helping other students resolve challenging steps. The students were proud to take teacher/expert roles. What is so unique in this matter is the fact that those students were not necessarily the brightest in their classrooms. It was uplifting to see the energy among these young students.
Alycia Hund
Professor
It is great to see enthusiasm from colleagues about the project. We agree that enthusiasm from the teachers and students we worked with was evident throughout our work, from planning and training to interactions in the classrooms and beyond. Of course, we appreciated seeing gains in spatial thinking, STEM knowledge, and technology skills, as well.
Arthur Camins
Director
Your presentation shows kids excited about sense making, taking on challenges and collaboration. Very exciting. In many classrooms that marks a big shift. The instructional materials are a starting point. Are there any PD challenges you can share about helping teachers to make effective use of your curriculum?
Joel Studebaker
Project Manager
Thanks for the question, Arthur! Of course there are always PD challenges with any new venture in education. We were lucky to work closely with the teachers who implemented the curriculum over the past two years. We had 20 hours of training over the summer preceding the intervention, and then continued support over the course of the implementation (which lasted about six weeks).
Because of our data collection, we also had someone in the classroom for every session – our purpose in being there was not to help teachers, but it certainly helped teachers feel more at ease at the beginning to have a team member in the room. We also had to work closely with the district’s technology department to get the software prepared, something we did not ask teachers to do themselves. We’re currently working on ways to support teachers without as much one-on-one contact, and are planning to provide all of the training exercises we did with teachers in person in an online format this summer. We’re pretty excited about some of the ideas we have! This is, by far, one of our biggest considerations going forward; to make sure that the curriculum is accessible to as many teachers as possible.
You can see an example of the online supports, including the video tutorials, we had for teachers at http://goo.gl/FR1z5E.
We’re polishing and updating all of our materials so that they work better for teachers we can’t train for 20 hours in person, and will be posting them this summer on our new website www.teachatlas.com.
William Finzer
I love seeing 5th graders working with GIS data! As PI for CODAP (http://videohall.com/p/740) which also features GIS data, I’d like to know what technology you used so that students could interact with maps? I wonder if there is a possible collaboration between our projects?
Jonathan Thayn
Associate Professor
William, we used QGIS, rather than one of the more powerful GIS software packages, primarily because it is simple (so students could manipulate it easier) and lightweight (so that older or less power computer systems would be able to handle the load). Also, QGIS runs on many operating systems.
I really like your project, which is certainly in line with our goals to increase data literacy. Surely there is some fruitful collaboration to be done.
May Jadallah
Associate Professor
We used QGIS; we preferred it over other software due to the fact that it is an open source. Our data files are available online (http://education.illinoisstate.edu/nsf/maps/). It will be wonderful to collaborate.
Joel Studebaker
Project Manager
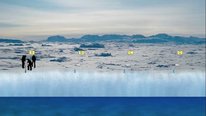
Hi William, QGIS is where most of the magic happens. Students use it to locate areas that meet the criteria of whatever problem they need to solve. Once they’ve located areas that match their criteria, they export the locations to Google Earth to look at the satellite imagery. This lets them check the solutions they arrive at from spatial data against the what they can observe by virtually exploring the area.
At one point we asked students to navigate a data attribute table in QGIS, but removed that portion of the activity due to instructional time constraints. Moving forward, it would be great to ask students to explore the raw data in addition to the visual representation of data. There are certainly parallels between our projects, and there is certainly potential for a collaboration! You can see more about what students actually do with QGIS on our website here:
http://www.teachatlas.com/our-curriculum.html
William Finzer
QGIS looks very capable. I haven’t tried it to see how user friendly it is.
One thing that has particularly pleased and surprised us in the CODAP project is the mileage learners get from dynamic linking of selection between graphs and maps. You could see a bit of that in our video. Have you noticed anything similar in your project?
Joel Studebaker
Project Manager
QGIS is very capable, and we find that students gain fluency in one or two 30 minute sessions. The students are typically less daunted by it than the teachers we work with, and removing unnecessary toolbars is easy enough if a student is especially distracted.
Ultimately we’ve been very pleased with the way students develop criteria for solving a problem, and then execute a strategy based on their own criteria. Because we’ve limited the available data, and the software does the processing for students, they only need to interact with the data as map layers. One of the primary questions for us is "Can students determine what data are necessary for solving this problem.”
But we are currently developing supplemental materials, and there are two applications I can imagine for the kind of approach you took with CODAP. For one, it would be great to ask students to evaluate data in multiple modes while forming their criteria. Second, it would be great to create problems that necessitate students examine data in multiple modes to make sense of the map-representation.
Jonathan Thayn
Associate Professor
It’s very simple to view a table of data associated with a map in QGIS, but the analysis methods are limited. Basic mathematical operations are possible, but graphing is not. Perhaps someone has written a plugin that can create graphs, but I haven’t seen it. (QGIS can be expanded using Python scripts.)
Elissa Milto
Director of Outreach
Hi,
I am wondering what you have done around professional development for the teachers and how you support them in the classroom.
Thanks, Elissa
Joel Studebaker
Project Manager
Thanks for the question, Elissa. I talked a little bit about PD in my response to Arthur Camins above. If you have any other questions about PD, we’d be happy to answer them!
Elissa Milto
Director of Outreach
Thanks, Joel. I’d missed the previous response.
Angeliki Pilati
Congratulations May!!! What an interesting project indeed.:-)) I hope that it can evolve into applications that can be distributed worldwide so that kids from different countries could benefit from it. We would love to use it here too, so if you ever need any international volunteers to experiment with, we are at your service :-))))
I am so very happy and proud of you my dear friend!
Keep up the good work :-)))
Greetings from Cyprus.
May Jadallah
Associate Professor
Thanks Angeliki. Our data files are available online (http://education.illinoisstate.edu/nsf/maps/). QGIS, the program that we use, is an open source and can be downloaded for free all over the world.
At one point, we hope to be able to develop materials that are applicable to solving problems in different parts of the world similar to the problems we have the students in the United States solve within the local setting. It will be wonderful and exciting to implement the program in Cyprus. Thanks again for your interest.
Elizabeth Kirby
I was very impressed with the enthusiasm of the students and the teachers and particularly the children’s awareness of the processes of the step by step scaffolding that led to the mastery of complex skills. Especially when working with children who face learning challenges, this knowledge, that learning is a gradual process and often incremental, is and can be a great confidence builder particularly when applied across domains and to diverse life experiences. How wonderful to see children so enthusiastic about learning!
May Jadallah
Associate Professor
Hi Elizabeth, this is an excellent point! The curriculum was designed to increase in complexity and decrease in scaffolding frequency to allow students to assist each other and become more comfortable as independent (from the teacher) yet collaborative learners. Positive classroom discourse improved students’ self-confidence and allowed them to hone their skills as they worked cooperatively.
Reecia Orzeck
Really impressive project. I hope you have the chance to present it at some Geography/GIS conferences as well as education conferences.
May Jadallah
Associate Professor
Thanks Reeica, we appreciate your encouragement and suggestion. We gave about 10 presentations in different conferences, few were in Geography conferences. We should consider a GIS conference in the near future. A great idea!
Kay Grabow
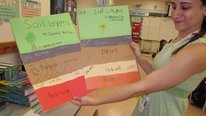
It was inspiring to hear the comments from students and teachers about how much they enjoyed using the QGIS curriculum materials. I was the author of the stories about animals used in the curriculum, and I am glad that these stories could be used as a jumping off point to add interest and to give the students reasons for using the mapping skills. I learned a great deal myself while using books, articles and web sources to provide accurate information about the animals. Now, I wish the students could teach me all the skills they learned about mapping!
May Jadallah
Associate Professor
Hi Kay, your stories made all the difference in our curriculum! The level of engagement was heightened when the students felt that it was their responsibility to bring the animals to back to safety. The students would be thrilled to show you how to use GIS. In three Open House events that took place in participating schools, students engaged parents, grandparents, and visitors in the use of GIS showing them how the program is used and what it can be used for.
Stephen Spaeth
May: You have identified another reason for starting this process at younger ages. We work with kids in a multi-age program (third-grade through high school). The elementary kids are eager to help and share their developing expertise with anyone who expresses an interest including their parents. In middle school and high school the willingness to share especially with parents seems to wane. Our older kids are ready and willing to perform but they generally don’t want to talk about it publicly. http://woodsideonewheelers.org
May Jadallah
Associate Professor
Hi Stephen, this is a very interesting note; thank you for suggesting another good reason for us to start early! Your Woodside One Weelers (WOW) program seems to be fantastic!
Joel Studebaker
Project Manager
Thanks for the comment, Steven — this is definitely an important point that I feel we have not thought much about. I think we certainly see that excitement building, and we hope that students’ enthusiasm for GIS transfers to a more generalized enthusiasm for technology and STEM as a whole. Of course most students won’t end up using GIS in their future careers, but I certainly hope that our programs helps students develop a confidence with technology so they can pursue their own interests independently.
Hyun Kang
The enthusiasm the teachers and their students show about the curriculum was heartwarming! As an applied linguist who has been passionate about the role of language in learning and teaching, their talk and interactions in the classroom have been fascinating to study. Considering the importance of spatial thinking skills for cognitive development, May and her co-PIs have done an amazing work for the participating students and the many generations to come…
May Jadallah
Associate Professor
Thanks Hyun, indeed examining classroom discourse by investigating the change in teacher indexicatly has been rewarding and seems to be promising. It is exciting to see how teachers are more likely to hedge (use probabilistic language) than boost (use confirmatory language) while utilizing technology in their instructional practice. The kind of questions that are being asked in the experimental classroom (open-ended) are also fundamentally different than the questions in the control classrooms (tend to be more on the close-ended side). These two aspects indicate that teachers adjust classroom language to support different types of thinking in the classroom.
Elizabeth Kirby
I don’t think that we should underestimate the likelihood that many or at least some of our students will be using GIS technology in their future careers. A conference I attend at UIUC several years ago indicated that skills in GIS technology were highly valued and much sought after in the job market. To give the students a head start in this area and the confidence to succeed could be a big plus for them not only in their education, but much later in their careers as well.
Joel Studebaker
Project Manager
Hi Elizabeth, I certainly agree that GIS skills are very valuable! However, I hope that the experience students have with out curriculum gives them the confidence to explore other areas of interest in technology as well, whether it be with creative media, production, design, data analysis, data visualization, or coding (or something I’ve never seen before). STEM fields will certainly be utilizing technology like GIS more and more, making it a valuable skill for students. But technology can also help students communicate in more effective ways, expand their artistry, solve problems, and – with coding – develop new software to approach any of these fields in new ways. Those are technology applications that are often left out of our classrooms, even as we push for more STEM inclusion.
I think it’s important, when we use technology in the classroom (especially at such early ages), that we are fostering broad sets of skills that students can apply within their own passions. After all, even if the fifth graders we work with today are using GIS in their future careers, it is likely to be very different (and hopefully easier to use)! I have to continually remind myself that the students we are working with now will not graduate high school until 2023, and will not be entering the workforce until 2027 – who knows what technology will bring in that time?
For that reason, I think it’s incredibly important that STEM education not create a false hierarchy of what kinds of technology or engineering are more valuable. We are constantly sending messages to students about what kind of work is valuable and important by the way we present things in our classrooms. So I prefer to not emphasize that GIS could be a pathway to a job. Instead, using GIS is a pathway to more confidence, more independence, and more skills. I want students to know that they can use that to make the world a better place. If they fall in love with GIS, great! But I want to make sure the students who do not fall in love with GIS get just as much from the experience. So, for me, the question of whether or not students will ever use GIS in their career is less important than “Is this a good tool for improving students’ learning, to make them better citizens, and to give them agency to shape the world for the better?”
Jonathan Thayn
Associate Professor
Nicely said, Joel. I am a GIS scientist so I hope that many of them are inspired to pursue GIS careers, but I agree, the most important outcome would be increased confidence in students’ abilities to use science to solve problems.
Joel Studebaker
Project Manager
I think many students that use GIS will be inspired to pursue GIS careers, and I hope even more of them will find innovative applications for GIS in fields where it is currently not used!
Elizabeth Kirby
I know from my work in our Natural Areas that GIS skills are highly in demand. Also, access to affordable and accessible software. Whatever applications are used, its a wonderful skill to have and it was great to know that the students came to use it with such a sense of confidence and engagement.
Further posting is closed as the showcase has ended.